flowchart TD
A[Data] --> B[population data]
A --> C[vaccination data]
C --> D[[recode region names]] --> E[[calculate age bands]] --> F[[calculate vaccination counts]]
B --> G[[calculate age bands]] --> H[[calculate population counts]]
F --> I[[join datasets]]
H --> I
I --> J[calculate rates and ci]
9 Flu vaccination coverage
9.1 Workflow
9.2 Clean data
Recode region names Add new age bands
Code
flu_data <- flu_data |>
    mutate(paed = dplyr::between(age, 0, 18),
           older = age >= 65) |>
    mutate(Region = case_when(str_detect(Region, "Baha") ~ "Al Bahah",
                              str_detect(Region, "Qu?assim") ~ "Al Qasim",
                              str_detect(Region, "Asir") ~ "`Asir",
                              str_detect(Region, "Hail") ~ "Ha'il",
                              str_detect(Region, "[Mm]adin") ~ "Al Madinah al Munawwarah",
                              str_detect(Region, "Jizan") ~ "Jazan",
                              str_detect(Region, "Makka") ~ "Makkah al Mukarramah",
                              str_detect(Region, "Sharqiya" ) ~ "Al Mintaqah ash Sharqiyah",
                              str_detect(Region, "Northern Frontier") ~ "Al Hudud ash Shamaliyah",
                              str_detect(Region, "Riyad") ~ "Ar Riyadh",
                              TRUE ~ Region ))
9.3 Calculate regional numerators and denominators
Calculate region-by-gender populations for 0-18 and 65+
Calculate region-by-gender vaccinations for 0-18 and 65+
Code
pop_paed <- popns |>
    group_by(Region, Gender, paed) |>
    reframe(pop = sum(Population)) |>
    filter(paed == "TRUE") |>
    mutate(Gender = recode(Gender, "Female" = "female", "Male" = "male"),
           Region = recode(Region, "`Asir" = "'Asir"))

pop_older <-popns |>
    group_by(Region, Gender, older) |>
    reframe(pop = sum(Population)) |>
    filter(older == "TRUE") |>
    mutate(Gender = recode(Gender, "Female" = "female", "Male" = "male"),
           Region = recode(Region, "`Asir" = "'Asir"))

## fills all region-gender categories and remove unknown
paed_flu <- flu_data |>
    filter(paed == "TRUE") |>
    count(Region, Gender) |>
    complete(Region, Gender) |>
    filter(Gender != "unknown") |>
    mutate( Region = recode(Region, "`Asir" = "'Asir"))

older_flu <- flu_data |>
    filter(older == "TRUE") |>
    count(Region, Gender) |>
    complete(Region, Gender) |>
    filter(Gender != "unknown") |>
    mutate( Region = recode(Region, "`Asir" = "'Asir"))
9.4 Join populations and vaccination data
Code
paed_nd <- paed_flu |>
  left_join(pop_paed) |>
  select(-paed)

older_nd <- older_flu |>
  left_join(pop_older) |>
  select(-older)
9.5 Calculate coverage by age group
Code
paed_coverage <- paed_nd |>
  phe_proportion(x = n, n = pop) |>
  mutate(age = "0-18")

older_coverage <- older_nd |>
  phe_proportion(x = n, n = pop) |>
  mutate(age = "65+")

bind_rows(paed_coverage, older_coverage) |>
    write_csv("data/flu_coverage.csv")
9.6 Tabulate
Code
options(digits = 3)

paed_coverage |>
  select(-c(statistic, method)) |>
  head() |>
  flextable()
older_coverage |>
  select(-c(statistic, method)) |>
  head() |>
flextable()Region | Gender | n | pop | value | lowercl | uppercl | confidence | age |
|---|---|---|---|---|---|---|---|---|
'Asir | female | 161 | 335,011 | 0.0004806 | 0.00041187 | 0.0005607 | 95% | 0-18 |
'Asir | male | 33 | 347,751 | 0.0000949 | 0.00006757 | 0.0001333 | 95% | 0-18 |
Al Bahah | female | 38 | 57,230 | 0.0006640 | 0.00048382 | 0.0009112 | 95% | 0-18 |
Al Bahah | male | 2 | 59,077 | 0.0000339 | 0.00000928 | 0.0001234 | 95% | 0-18 |
Al Hudud ash Shamaliyah | female | 1 | 70,350 | 0.0000142 | 0.00000251 | 0.0000805 | 95% | 0-18 |
Al Hudud ash Shamaliyah | male | 73,068 | 95% | 0-18 |
Region | Gender | n | pop | value | lowercl | uppercl | confidence | age |
|---|---|---|---|---|---|---|---|---|
'Asir | female | 49 | 32,224 | 0.001521 | 0.0011505 | 0.002010 | 95% | 65+ |
'Asir | male | 10 | 36,288 | 0.000276 | 0.0001497 | 0.000507 | 95% | 65+ |
Al Bahah | female | 1 | 7,791 | 0.000128 | 0.0000227 | 0.000727 | 95% | 65+ |
Al Bahah | male | 6,752 | 95% | 65+ | ||||
Al Madinah al Munawwarah | female | 24 | 31,099 | 0.000772 | 0.0005187 | 0.001148 | 95% | 65+ |
Al Madinah al Munawwarah | male | 14 | 31,231 | 0.000448 | 0.0002671 | 0.000752 | 95% | 65+ |
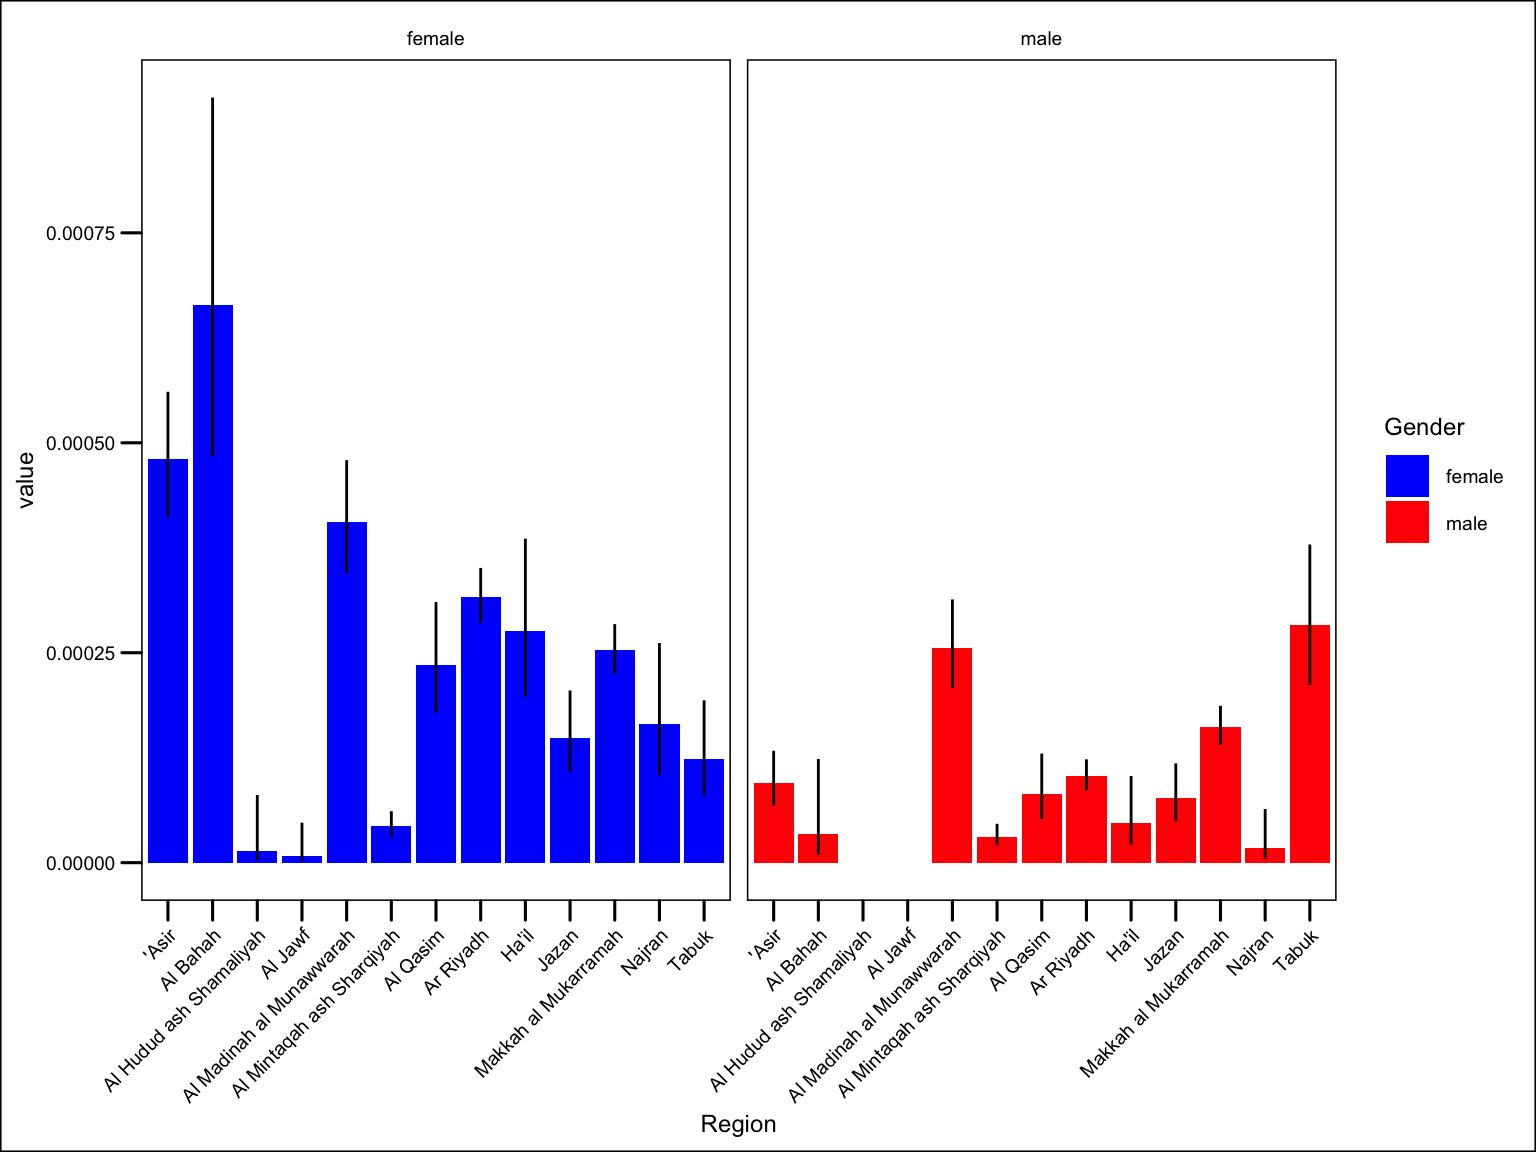
9.7 Visualise
Code
paed_coverage |>
ggplot() +
geom_col(aes(Region, value, fill = Gender)) +
geom_linerange(aes(Region, ymin = lowercl, ymax = uppercl)) +
theme(axis.text.x = element_text(angle = 45, hjust = 1) ) +
facet_wrap(~ Gender) +
scale_fill_manual(values = c("blue", "red"))
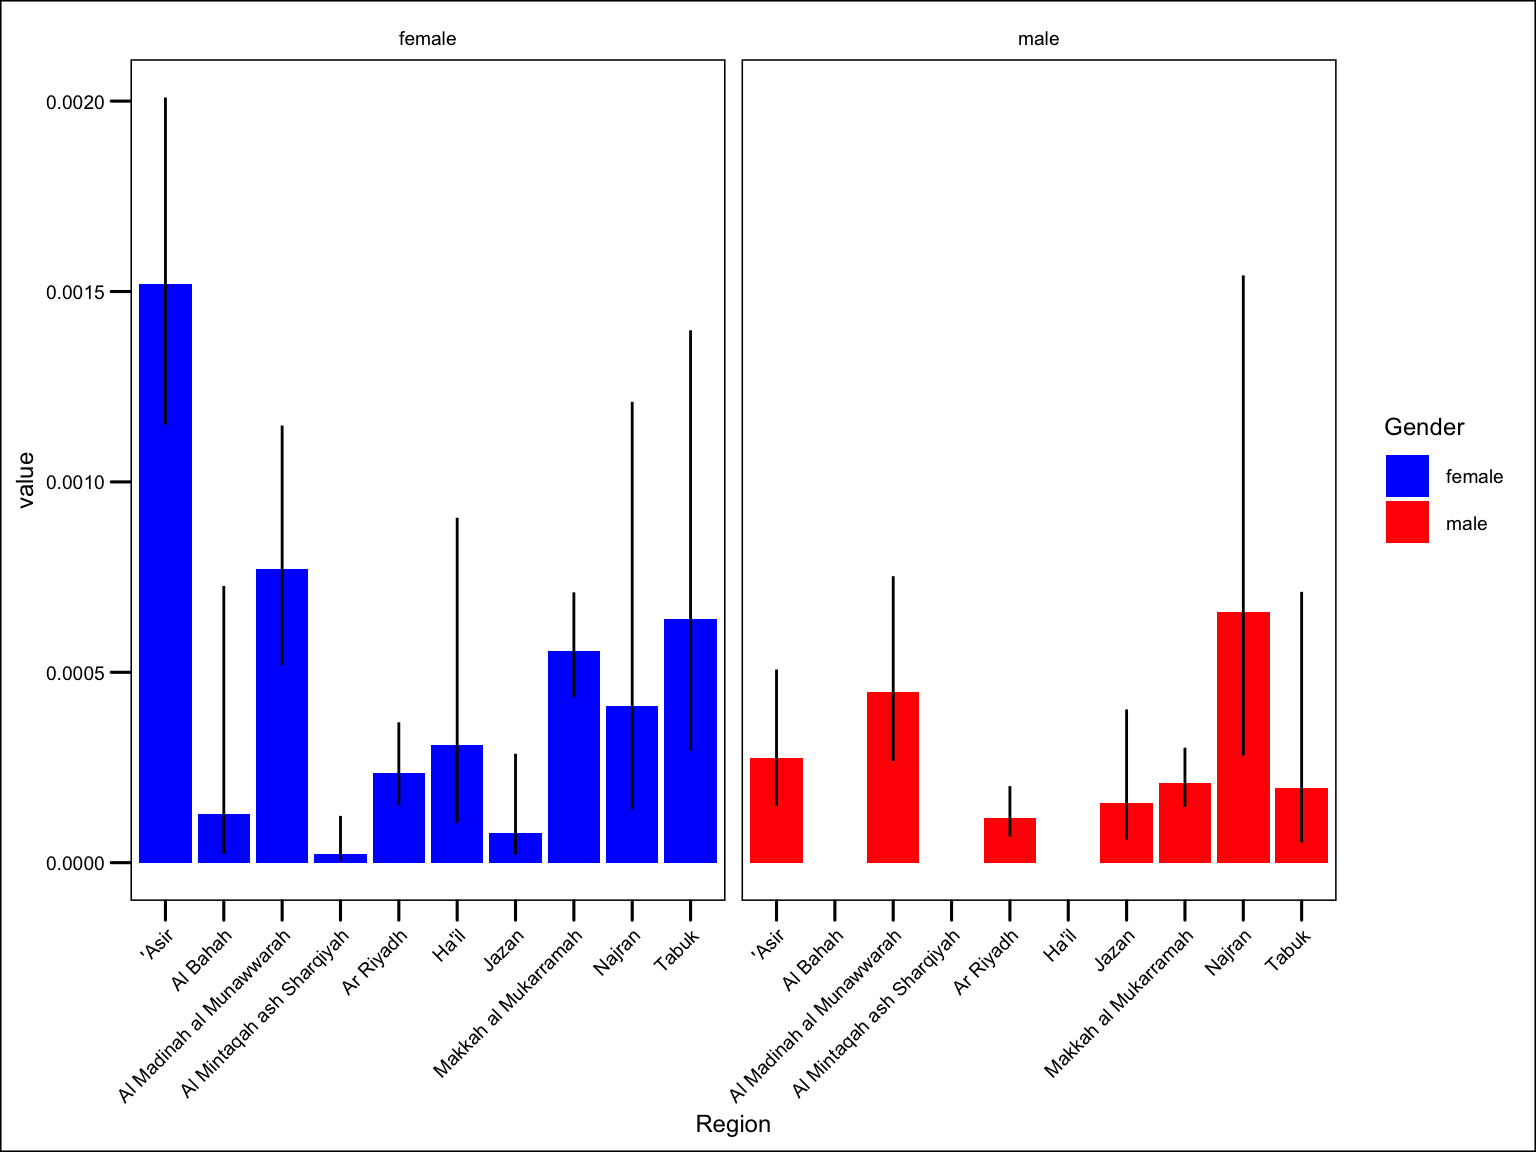
older_coverage |>
ggplot() +
geom_col(aes(Region, value, fill = Gender)) +
geom_linerange(aes(Region, ymin = lowercl, ymax = uppercl)) +
theme(axis.text.x = element_text(angle = 45, hjust = 1) ) +
facet_wrap(~ Gender) +
scale_fill_manual(values = c("blue", "red"))