age_band | resistant | sensitive | total | sum_res | sum_tot | mean_rate | value | lowercl | uppercl | confidence | method |
|---|---|---|---|---|---|---|---|---|---|---|---|
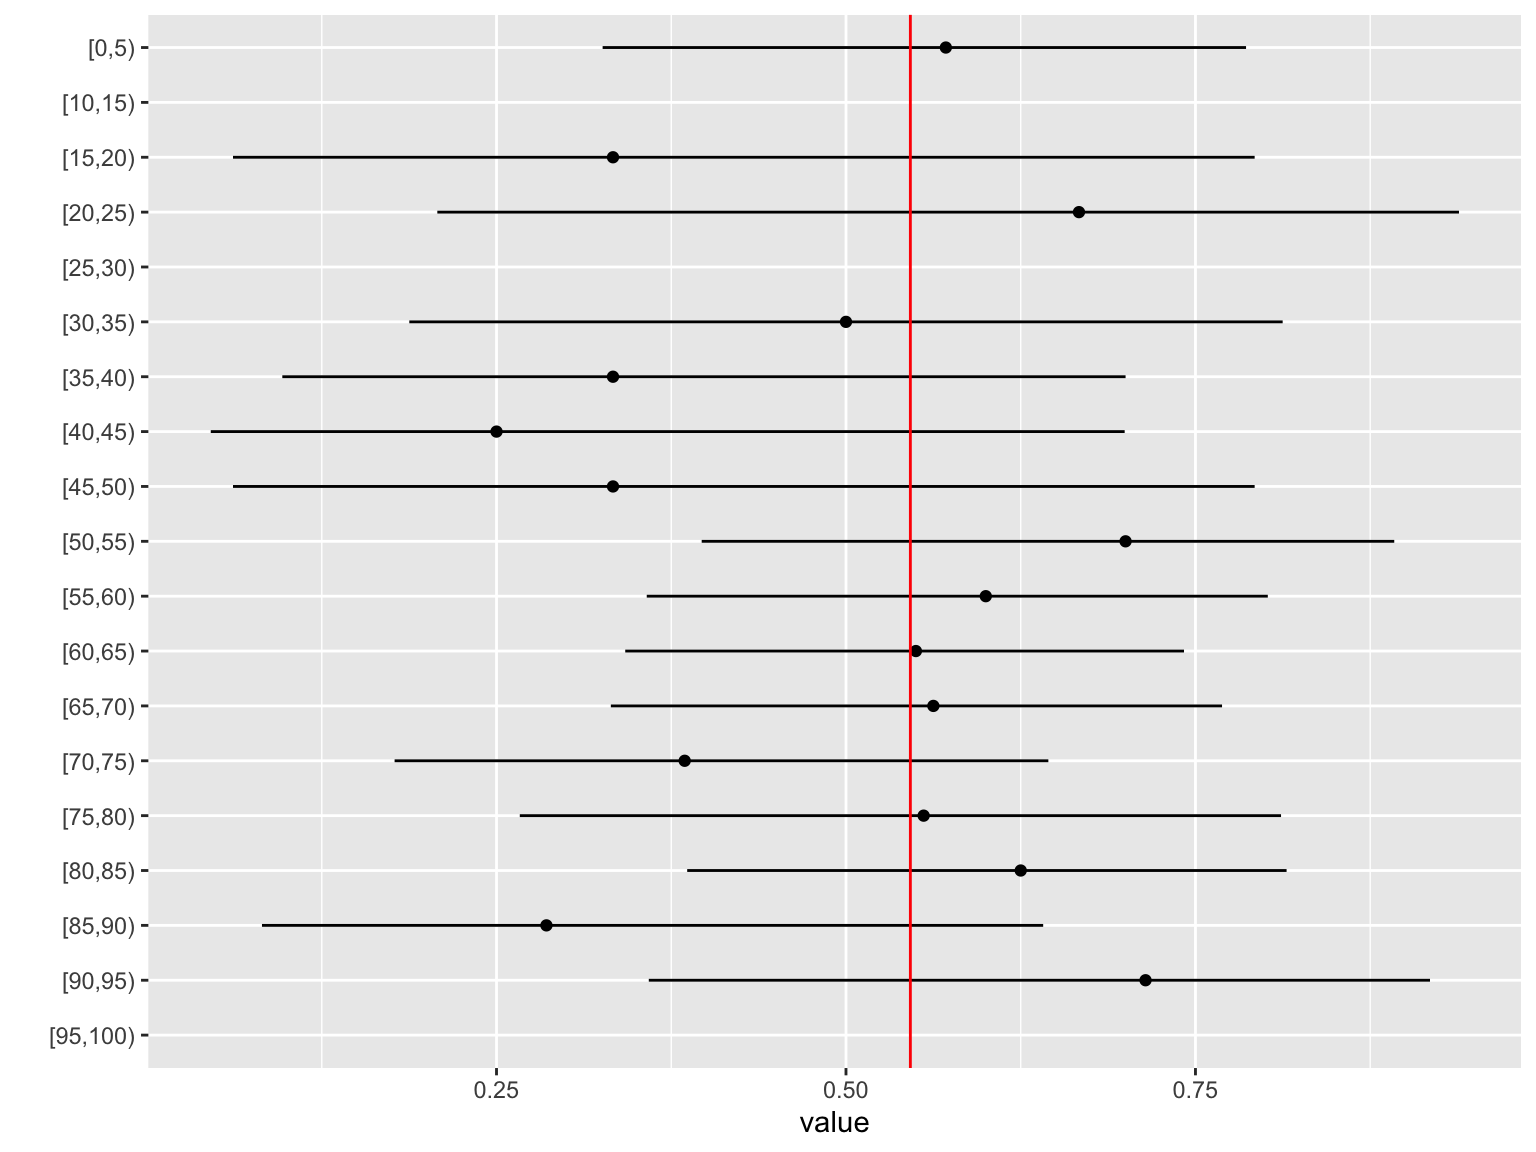
[0,5) | 8 | 6 | 14 | 83 | 152 | 0.546 | 0.571 | 0.3259 | 0.786 | 95% | Wilson |
[10,15) | 1 | 83 | 152 | 0.546 | 95% | Wilson | |||||
[15,20) | 1 | 2 | 3 | 83 | 152 | 0.546 | 0.333 | 0.0615 | 0.792 | 95% | Wilson |
[20,25) | 2 | 1 | 3 | 83 | 152 | 0.546 | 0.667 | 0.2077 | 0.939 | 95% | Wilson |
[25,30) | 1 | 83 | 152 | 0.546 | 95% | Wilson | |||||
[30,35) | 3 | 3 | 6 | 83 | 152 | 0.546 | 0.500 | 0.1876 | 0.812 | 95% | Wilson |
[35,40) | 2 | 4 | 6 | 83 | 152 | 0.546 | 0.333 | 0.0968 | 0.700 | 95% | Wilson |
[40,45) | 1 | 3 | 4 | 83 | 152 | 0.546 | 0.250 | 0.0456 | 0.699 | 95% | Wilson |
[45,50) | 1 | 2 | 3 | 83 | 152 | 0.546 | 0.333 | 0.0615 | 0.792 | 95% | Wilson |
[50,55) | 7 | 3 | 10 | 83 | 152 | 0.546 | 0.700 | 0.3968 | 0.892 | 95% | Wilson |
[55,60) | 9 | 6 | 15 | 83 | 152 | 0.546 | 0.600 | 0.3575 | 0.802 | 95% | Wilson |
[60,65) | 11 | 9 | 20 | 83 | 152 | 0.546 | 0.550 | 0.3421 | 0.742 | 95% | Wilson |
[65,70) | 9 | 7 | 16 | 83 | 152 | 0.546 | 0.562 | 0.3318 | 0.769 | 95% | Wilson |
[70,75) | 5 | 8 | 13 | 83 | 152 | 0.546 | 0.385 | 0.1771 | 0.645 | 95% | Wilson |
[75,80) | 5 | 4 | 9 | 83 | 152 | 0.546 | 0.556 | 0.2667 | 0.811 | 95% | Wilson |
[80,85) | 10 | 6 | 16 | 83 | 152 | 0.546 | 0.625 | 0.3864 | 0.815 | 95% | Wilson |
[85,90) | 2 | 5 | 7 | 83 | 152 | 0.546 | 0.286 | 0.0822 | 0.641 | 95% | Wilson |
[90,95) | 5 | 2 | 7 | 83 | 152 | 0.546 | 0.714 | 0.3589 | 0.918 | 95% | Wilson |
[95,100) | 1 | 83 | 152 | 0.546 | 95% | Wilson |
4 Data summaries
4.1 AMR
The dummy data is per patient sample based.
4.1.1 E. coli
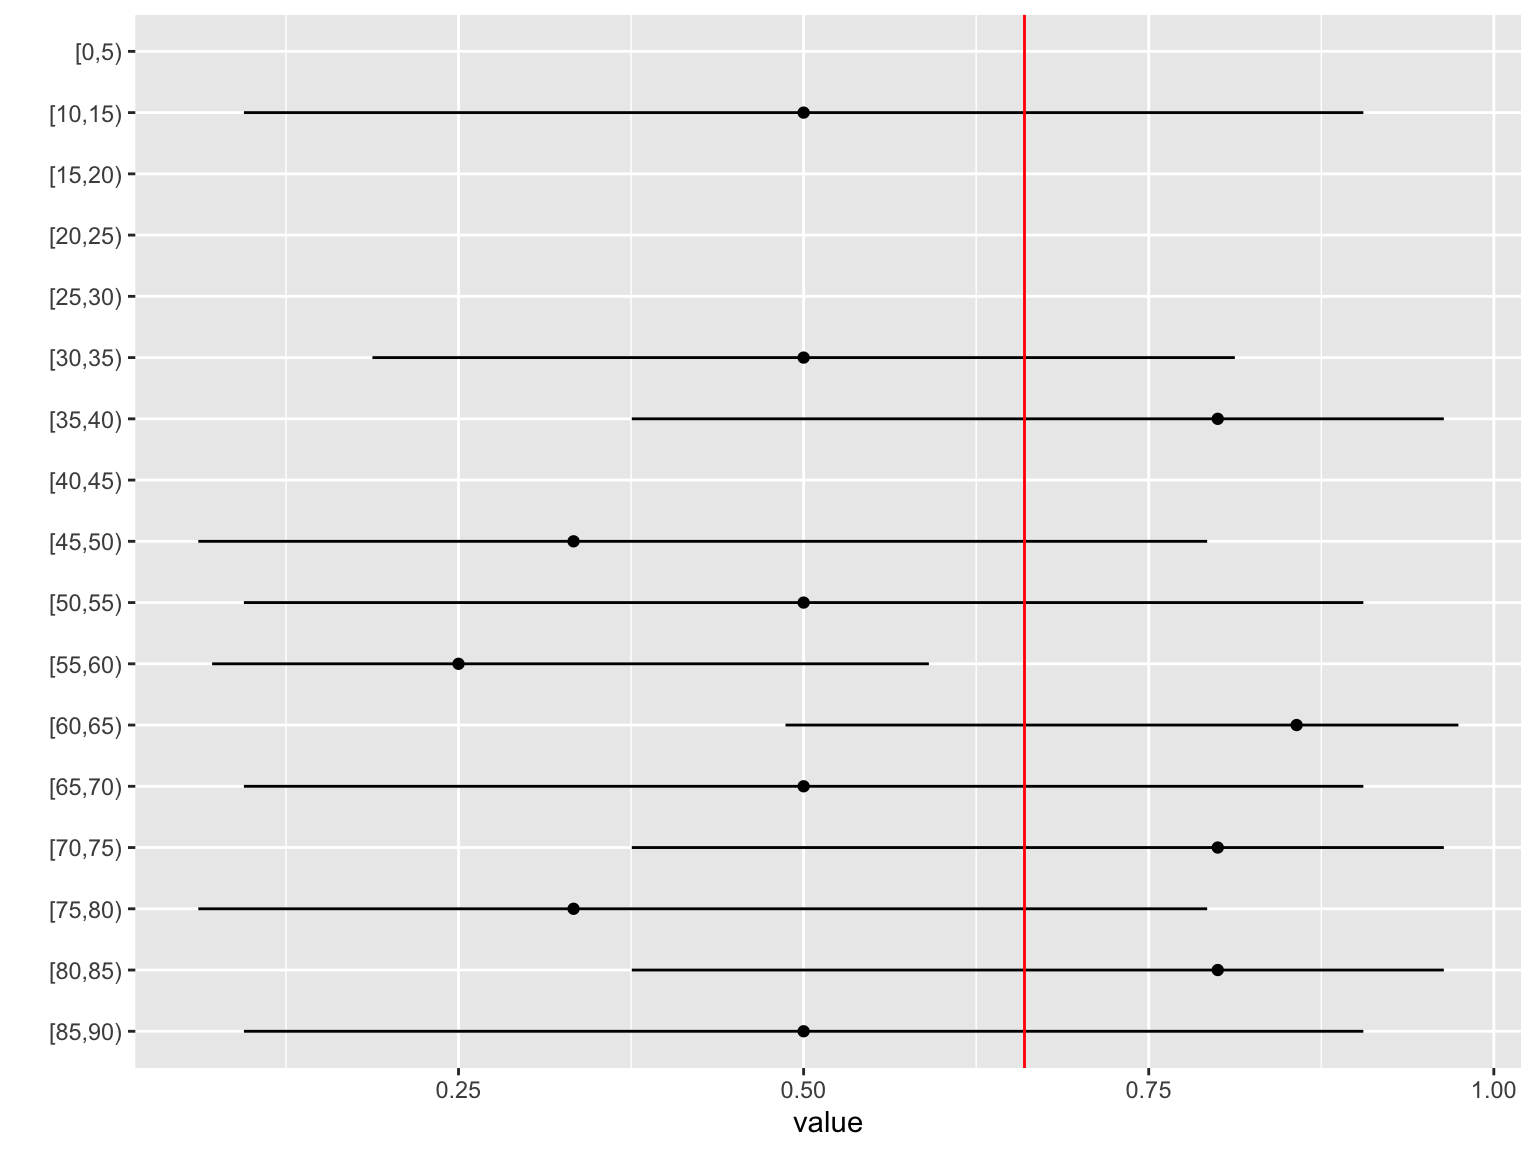
4.1.2 S.aureus
age_band | resistant | sensitive | total | sum_res | sum_tot | mean_rate | value | lowercl | uppercl | confidence | method |
|---|---|---|---|---|---|---|---|---|---|---|---|
[0,5) | 4 | 33 | 50 | 0.66 | 95% | Wilson | |||||
[10,15) | 1 | 1 | 2 | 33 | 50 | 0.66 | 0.500 | 0.0945 | 0.905 | 95% | Wilson |
[15,20) | 2 | 33 | 50 | 0.66 | 95% | Wilson | |||||
[20,25) | 1 | 33 | 50 | 0.66 | 95% | Wilson | |||||
[25,30) | 2 | 33 | 50 | 0.66 | 95% | Wilson | |||||
[30,35) | 3 | 3 | 6 | 33 | 50 | 0.66 | 0.500 | 0.1876 | 0.812 | 95% | Wilson |
[35,40) | 4 | 1 | 5 | 33 | 50 | 0.66 | 0.800 | 0.3755 | 0.964 | 95% | Wilson |
[40,45) | 1 | 33 | 50 | 0.66 | 95% | Wilson | |||||
[45,50) | 1 | 2 | 3 | 33 | 50 | 0.66 | 0.333 | 0.0615 | 0.792 | 95% | Wilson |
[50,55) | 1 | 1 | 2 | 33 | 50 | 0.66 | 0.500 | 0.0945 | 0.905 | 95% | Wilson |
[55,60) | 2 | 6 | 8 | 33 | 50 | 0.66 | 0.250 | 0.0715 | 0.591 | 95% | Wilson |
[60,65) | 6 | 1 | 7 | 33 | 50 | 0.66 | 0.857 | 0.4869 | 0.974 | 95% | Wilson |
[65,70) | 1 | 1 | 2 | 33 | 50 | 0.66 | 0.500 | 0.0945 | 0.905 | 95% | Wilson |
[70,75) | 4 | 1 | 5 | 33 | 50 | 0.66 | 0.800 | 0.3755 | 0.964 | 95% | Wilson |
[75,80) | 1 | 2 | 3 | 33 | 50 | 0.66 | 0.333 | 0.0615 | 0.792 | 95% | Wilson |
[80,85) | 4 | 1 | 5 | 33 | 50 | 0.66 | 0.800 | 0.3755 | 0.964 | 95% | Wilson |
[85,90) | 1 | 1 | 2 | 33 | 50 | 0.66 | 0.500 | 0.0945 | 0.905 | 95% | Wilson |
4.2 Flu vaccination coverage
age_groups | gender | Al Baha | Al Jawf | Al Qassim | Asir | Hail | Jazan | Makkah Al Mukarramah | Najran | Northern Frontier | Riyadh | Sharqiya | Tabuk | madina |
|---|---|---|---|---|---|---|---|---|---|---|---|---|---|---|
0-18 | female | 38 | 1 | 50 | 161 | 34 | 37 | 282 | 18 | 1 | 361 | 31 | 19 | 140 |
0-18 | male | 2 | 18 | 33 | 6 | 20 | 188 | 2 | 122 | 23 | 45 | 91 | ||
65+ | female | 1 | 49 | 3 | 2 | 64 | 3 | 19 | 1 | 6 | 24 | |||
65+ | male | 10 | 4 | 29 | 5 | 13 | 2 | 14 | ||||||
other | female | 69 | 157 | 753 | 167 | 105 | 1,182 | 48 | 2 | 1,260 | 102 | 127 | 765 | |
other | male | 9 | 1 | 74 | 295 | 37 | 120 | 938 | 50 | 1 | 536 | 199 | 229 | 443 |
4.3 Smoking
Counts of female smoking clinic attendees by directorate for 15+ and 18-44 years
age_1844 | directorate_name | female |
|---|---|---|
1 | AlAhsa | 73 |
1 | Asir | 9 |
1 | Baha | 28 |
1 | Bisha | 6 |
1 | Eastern | 551 |
1 | Hafer AlBatin | 60 |
1 | Hail | 22 |
1 | Jazan | 145 |
1 | Jeddah | 1,569 |
1 | Jouf | 23 |
1 | Madinah | 205 |
1 | Makkah | 578 |
1 | Najran | 82 |
1 | Northern Borders | 4 |
1 | Qassim | 22 |
1 | Qunfotha | 13 |
1 | Riyadh | 1,830 |
1 | Tabuk | 291 |
1 | Taif | 100 |
age_15 | directorate_name | female |
|---|---|---|
1 | AlAhsa | 93 |
1 | Asir | 84 |
1 | Baha | 28 |
1 | Bisha | 6 |
1 | Eastern | 579 |
1 | Hafer AlBatin | 60 |
1 | Hail | 22 |
1 | Jazan | 158 |
1 | Jeddah | 1,788 |
1 | Jouf | 28 |
1 | Madinah | 303 |
1 | Makkah | 636 |
1 | Najran | 85 |
1 | Northern Borders | 7 |
1 | Qassim | 48 |
1 | Qunfotha | 13 |
1 | Qurayyat | 4 |
1 | Riyadh | 1,862 |
1 | Tabuk | 436 |
1 | Taif | 136 |
4.4 Injury
