Code
df <- amrThis document outlines a stepwise approach to calculating AMR indicators from dummy data kindly supplied by PHA.
There are x steps
EDA (exploratory data analysis of raw data) - this involves cleaning, visualisation and creation of relevant variables.
Review of indicator definitions
Numerator
Denominator
Method for calculating numerator and denominator values from dataset. The outline uses R code for reproducibility and flexibility.
Calculating indicator values and uncertainty intervals
Suggested indicator visualisations (if appropriate).
Percentage of bloodstream infection due to methicillin-resistant Staphylococcus aureus (MRSA)
Numerator: No. of patients with growth of methicillin-resistant S. aureus in tested blood samples
Denominator: Total No. of patients with growth of S. aureus in tested blood samples
Percentage of bloodstream infection due to 3rd-generation cephalosporin resistant E. coli
Numerator: No. of patients with growth of 3rd-generation cephalosporin resistant E. coli in tested blood samples
Denominator: Total No. of patients with growth of E. coli in tested blood samples
df <- amr334 observations
amr <- amr[, `:=` (age_band = cut(age_year, breaks = seq(0, 100, 5), right = FALSE))][]

head(amr)
record_number sample_no patient_mrn location
<num> <char> <char> <char>
1: 1 ###### ##### Outpatient
2: 17 ###### ##### Inpatient
3: 20 ###### ##### Inpatient
4: 25 ###### ##### Inpatient
5: 43 ###### ##### Outpatient
6: 63 ###### ##### Outpatient
patient_hospitalized
<char>
1: Patient had NOT been admitted for more than 2 days in the past 30 days
2: Patient has been hospitalized for 2 days or less
3: Patient has been hospitalized for more than 2 days
4: Patient has been hospitalized for 2 days or less
5: Patient had NOT been admitted for more than 2 days in the past 30 days
6: Patient had NOT been admitted for more than 2 days in the past 30 days
specific_location age_year community_origin site first_name second_name
<char> <num> <char> <char> <char> <char>
1: Emergency Room 0 Community Origin Blood #### #####
2: Intensive Care Unit 71 Community Origin Blood #### #####
3: Intensive Care Unit 44 Hospital Origin Blood #### #####
4: Intensive Care Unit 67 Community Origin Blood #### #####
5: Emergency Room 67 Community Origin Blood #### #####
6: Emergency Room 92 Community Origin Blood #### #####
family_name national_iqama_id nationality pathogen_name minocycline
<char> <char> <char> <char> <lgcl>
1: #### ########## ##### Escherichia coli NA
2: #### ########## ##### Escherichia coli NA
3: #### ########## ##### Escherichia coli NA
4: #### ########## ##### Escherichia coli NA
5: #### ########## ##### Escherichia coli NA
6: #### ########## ##### Escherichia coli NA
tigecycline ampicillin penicillin_g oxacillin cefoxitin cefotaxime
<lgcl> <char> <lgcl> <char> <char> <char>
1: NA R NA <NA> <NA> R
2: NA R NA <NA> <NA> NA
3: NA S NA <NA> <NA> S
4: NA R NA <NA> <NA> R
5: NA R NA <NA> <NA> NA
6: NA R NA <NA> <NA> NA
ceftazidime ceftriaxone cefixime cefepime doripenem ertapenem imipenem
<char> <char> <lgcl> <char> <char> <char> <char>
1: R R NA R NA S S
2: S S NA S NA S S
3: S S NA S NA S S
4: R R NA R NA S S
5: I S NA S NA S S
6: R R NA R R S S
meropenem co_trimoxazole azithromycin amikacin gentamicin ciprofloxacin
<char> <char> <lgcl> <lgcl> <lgcl> <char>
1: S S NA NA NA S
2: S S NA NA NA S
3: S S NA NA NA S
4: S R NA NA NA S
5: S S NA NA NA S
6: S R NA NA NA R
levofloxacin colistin spectinomycin age_band
<char> <char> <lgcl> <fctr>
1: S NA NA [0,5)
2: S S NA [70,75)
3: S NA NA [40,45)
4: S NA NA [65,70)
5: S S NA [65,70)
6: R S NA [90,95)This step removes identifiers (names, record IDs)
amr <- amr |> select(-c(family_name, first_name, sample_no, patient_mrn, second_name, national_iqama_id, nationality))amr_long <- amr |>
pivot_longer(names_to = "antibiotic", values_to = "resistance", cols = minocycline:spectinomycin) |> setDT()amr_long <- amr_long[, gen_3 := case_when(str_detect(antibiotic, "cef") ~ "3rd-gen", TRUE ~ "other")][]gtsummary::tbl_summary(amr)amr_freq <- amr_long[pathogen_name == "Escherichia coli", .N, by = .(age_band, gen_3, resistance, pathogen_name, community_origin)]
collapsibleTreeSummary(amr_freq,
c( "community_origin", "gen_3","resistance"),
root = "E. coli",
nodeSize = "N",
attribute = "N",
fontSize = 16,
collapsed = FALSE)To calculate indicators we need to calculate
amr_longIndex: <pathogen_name>
record_number location
<num> <char>
1: 1 Outpatient
2: 1 Outpatient
3: 1 Outpatient
4: 1 Outpatient
5: 1 Outpatient
---
7678: 1210 Inpatient
7679: 1210 Inpatient
7680: 1210 Inpatient
7681: 1210 Inpatient
7682: 1210 Inpatient
patient_hospitalized
<char>
1: Patient had NOT been admitted for more than 2 days in the past 30 days
2: Patient had NOT been admitted for more than 2 days in the past 30 days
3: Patient had NOT been admitted for more than 2 days in the past 30 days
4: Patient had NOT been admitted for more than 2 days in the past 30 days
5: Patient had NOT been admitted for more than 2 days in the past 30 days
---
7678: Patient has been hospitalized for more than 2 days
7679: Patient has been hospitalized for more than 2 days
7680: Patient has been hospitalized for more than 2 days
7681: Patient has been hospitalized for more than 2 days
7682: Patient has been hospitalized for more than 2 days
specific_location age_year community_origin site pathogen_name
<char> <num> <char> <char> <char>
1: Emergency Room 0 Community Origin Blood Escherichia coli
2: Emergency Room 0 Community Origin Blood Escherichia coli
3: Emergency Room 0 Community Origin Blood Escherichia coli
4: Emergency Room 0 Community Origin Blood Escherichia coli
5: Emergency Room 0 Community Origin Blood Escherichia coli
---
7678: Non Intensive Unit 96 Hospital Origin Blood Staphylococcus aureus
7679: Non Intensive Unit 96 Hospital Origin Blood Staphylococcus aureus
7680: Non Intensive Unit 96 Hospital Origin Blood Staphylococcus aureus
7681: Non Intensive Unit 96 Hospital Origin Blood Staphylococcus aureus
7682: Non Intensive Unit 96 Hospital Origin Blood Staphylococcus aureus
age_band antibiotic resistance gen_3
<fctr> <char> <char> <char>
1: [0,5) minocycline <NA> other
2: [0,5) tigecycline <NA> other
3: [0,5) ampicillin R other
4: [0,5) penicillin_g <NA> other
5: [0,5) oxacillin <NA> other
---
7678: [95,100) gentamicin <NA> other
7679: [95,100) ciprofloxacin R other
7680: [95,100) levofloxacin R other
7681: [95,100) colistin NA other
7682: [95,100) spectinomycin <NA> otherPHEindicatormethods R package)amr_long[pathogen_name == "Escherichia coli" & !is.na(resistance), .N, by = .(resistance, gen_3)] |>
pivot_wider(names_from = resistance, values_from = N) |>
rowwise() |>
mutate(total_tests = sum(c_across(R:I), na.rm = TRUE),
resistance_rate = R / total_tests) |>
flextable::flextable()gen_3 | R | NA | S | I | total_tests | resistance_rate |
|---|---|---|---|---|---|---|
other | 300 | 193 | 646 | 7 | 1,146 | 0.2617801 |
3rd-gen | 269 | 56 | 192 | 4 | 521 | 0.5163148 |
options(digits = 2)

amr_res_ci_sa <- amr_long[pathogen_name == "Staphylococcus aureus" & !is.na(resistance), .N, by = .(antibiotic, resistance)] |>
    pivot_wider(names_from = resistance, values_from = N, values_fill = 0) |>
    rowwise() |>
    mutate(total_tests = sum(c_across(S:I), na.rm = TRUE),
           resistance_rate = R / total_tests)

phe_proportion(amr_res_ci_sa, R, total_tests) |>
    bind_cols(amr_res_ci_sa) |>
    ggplot() +
    geom_point(aes(reorder(antibiotic, value), value)) +
    geom_linerange(aes(antibiotic, ymin = lowercl, ymax = uppercl)) +
    coord_flip() +
    labs(y = "Staph. aureus resistance rate", x = "") +
    scale_y_continuous(position = "right")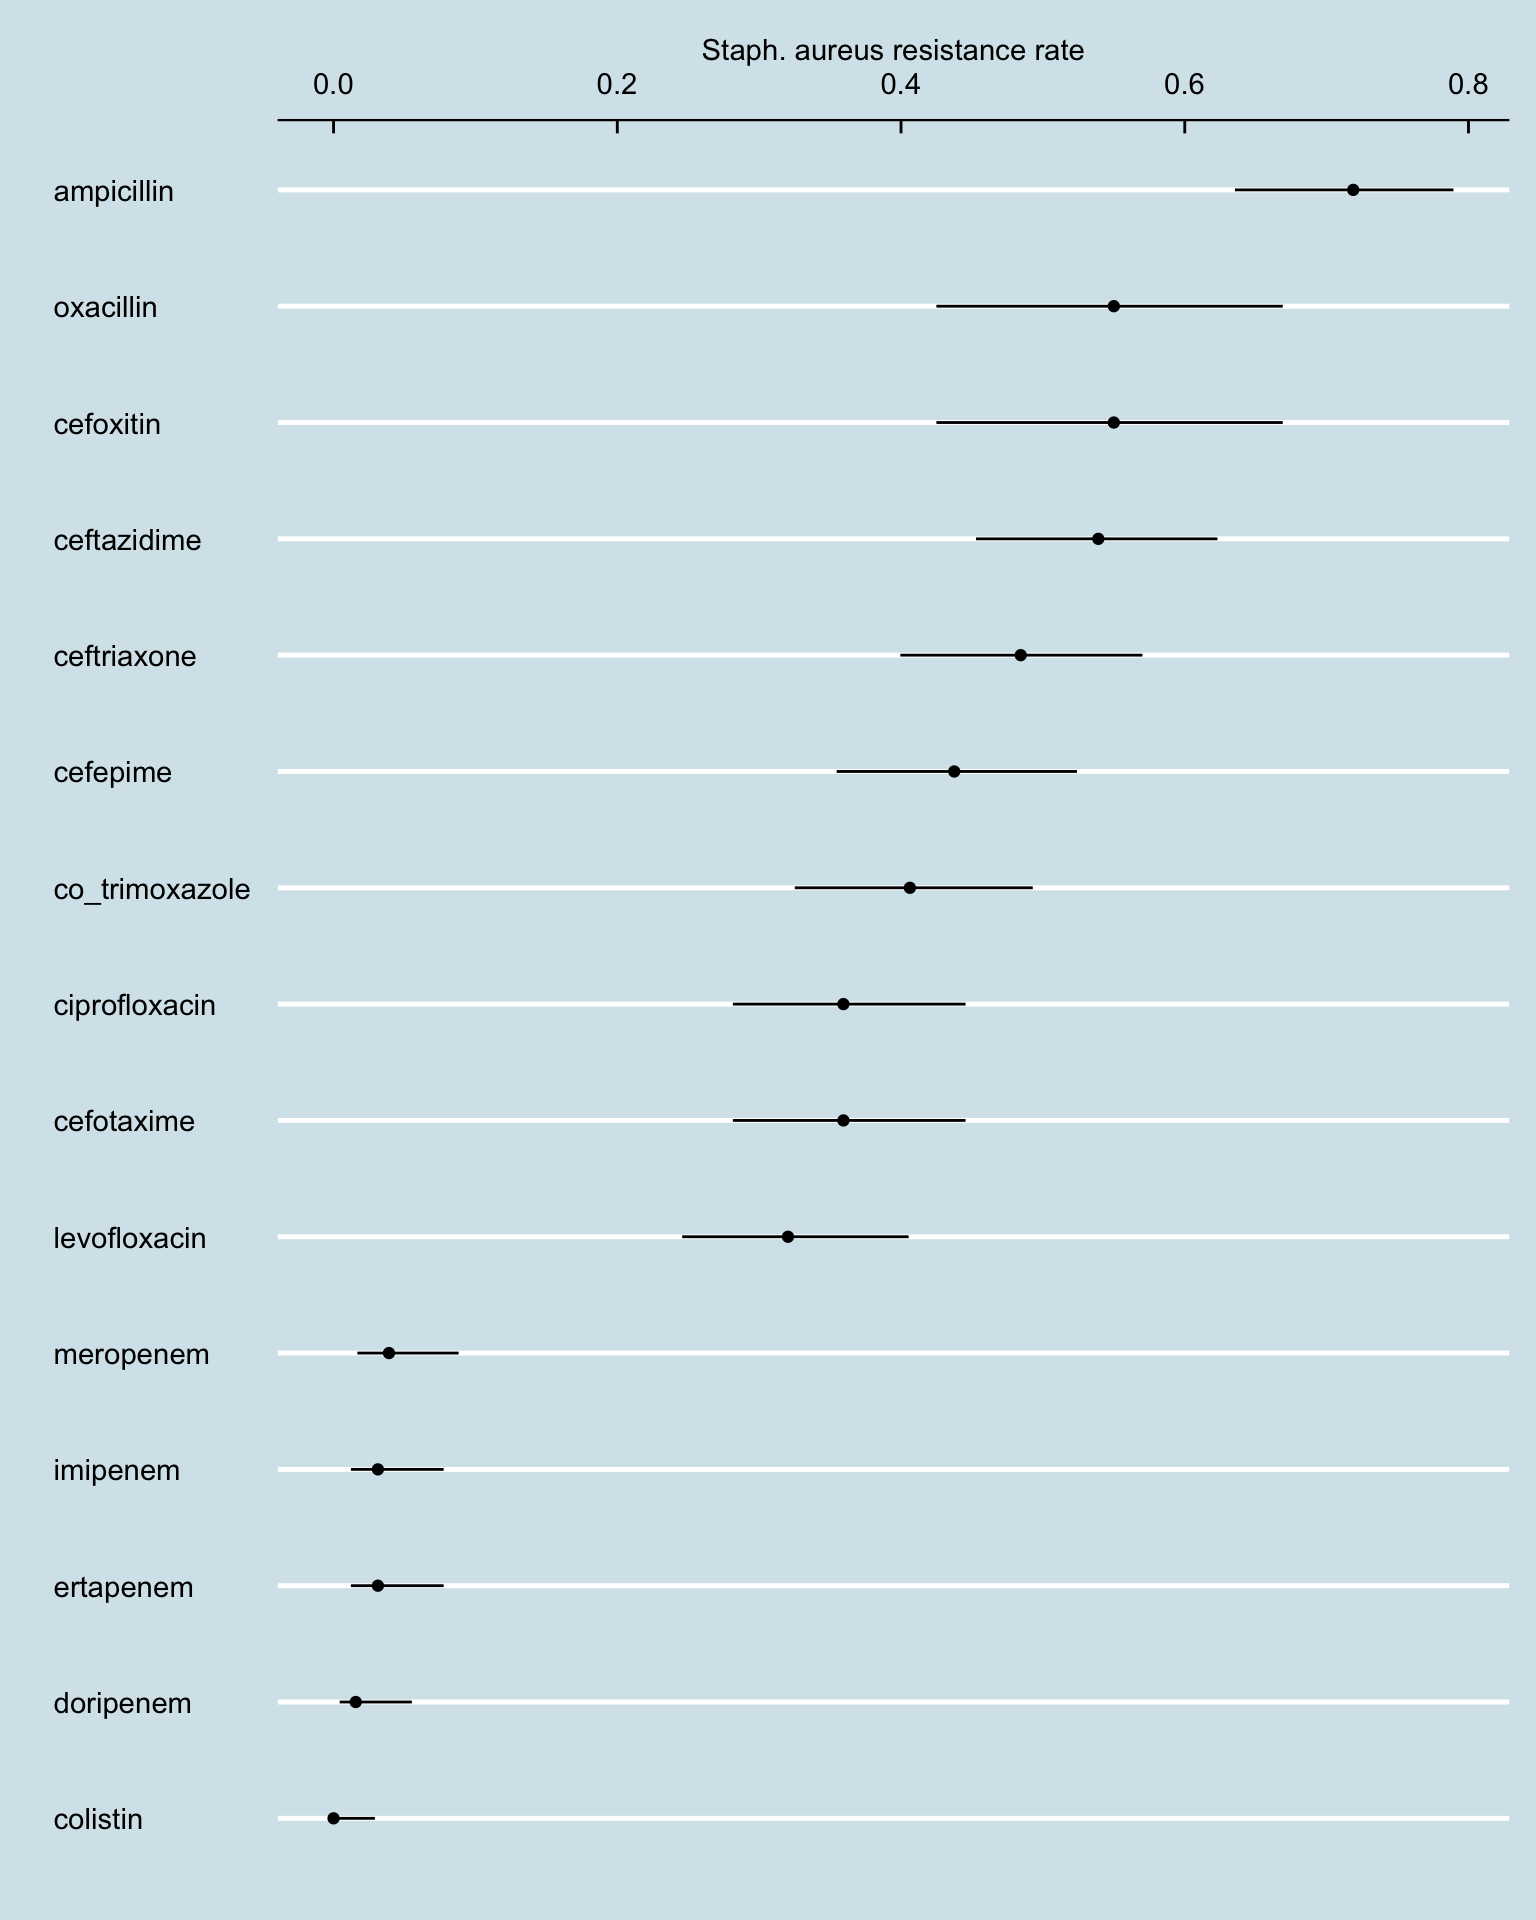
amr_res_ci_age <- amr_long[pathogen_name == "Staphylococcus aureus" & !is.na(resistance), .N, by = .(age_band, resistance)] |>
    pivot_wider(names_from = resistance, values_from = N, values_fill = 0) |>
    rowwise() |>
    mutate(total_tests = sum(c_across(S:I), na.rm = TRUE),
           resistance_rate = R / total_tests)

phe_proportion(amr_res_ci_age, R, total_tests) |>
    bind_cols(amr_res_ci_age) |>
    ggplot() +
    geom_point(aes(reorder(age_band, value), value)) +
    geom_linerange(aes(age_band, ymin = lowercl, ymax = uppercl)) +
    coord_flip() +
    labs(y = "Staph. aureus resistance rate", x = "") +
    scale_y_continuous(position = "right")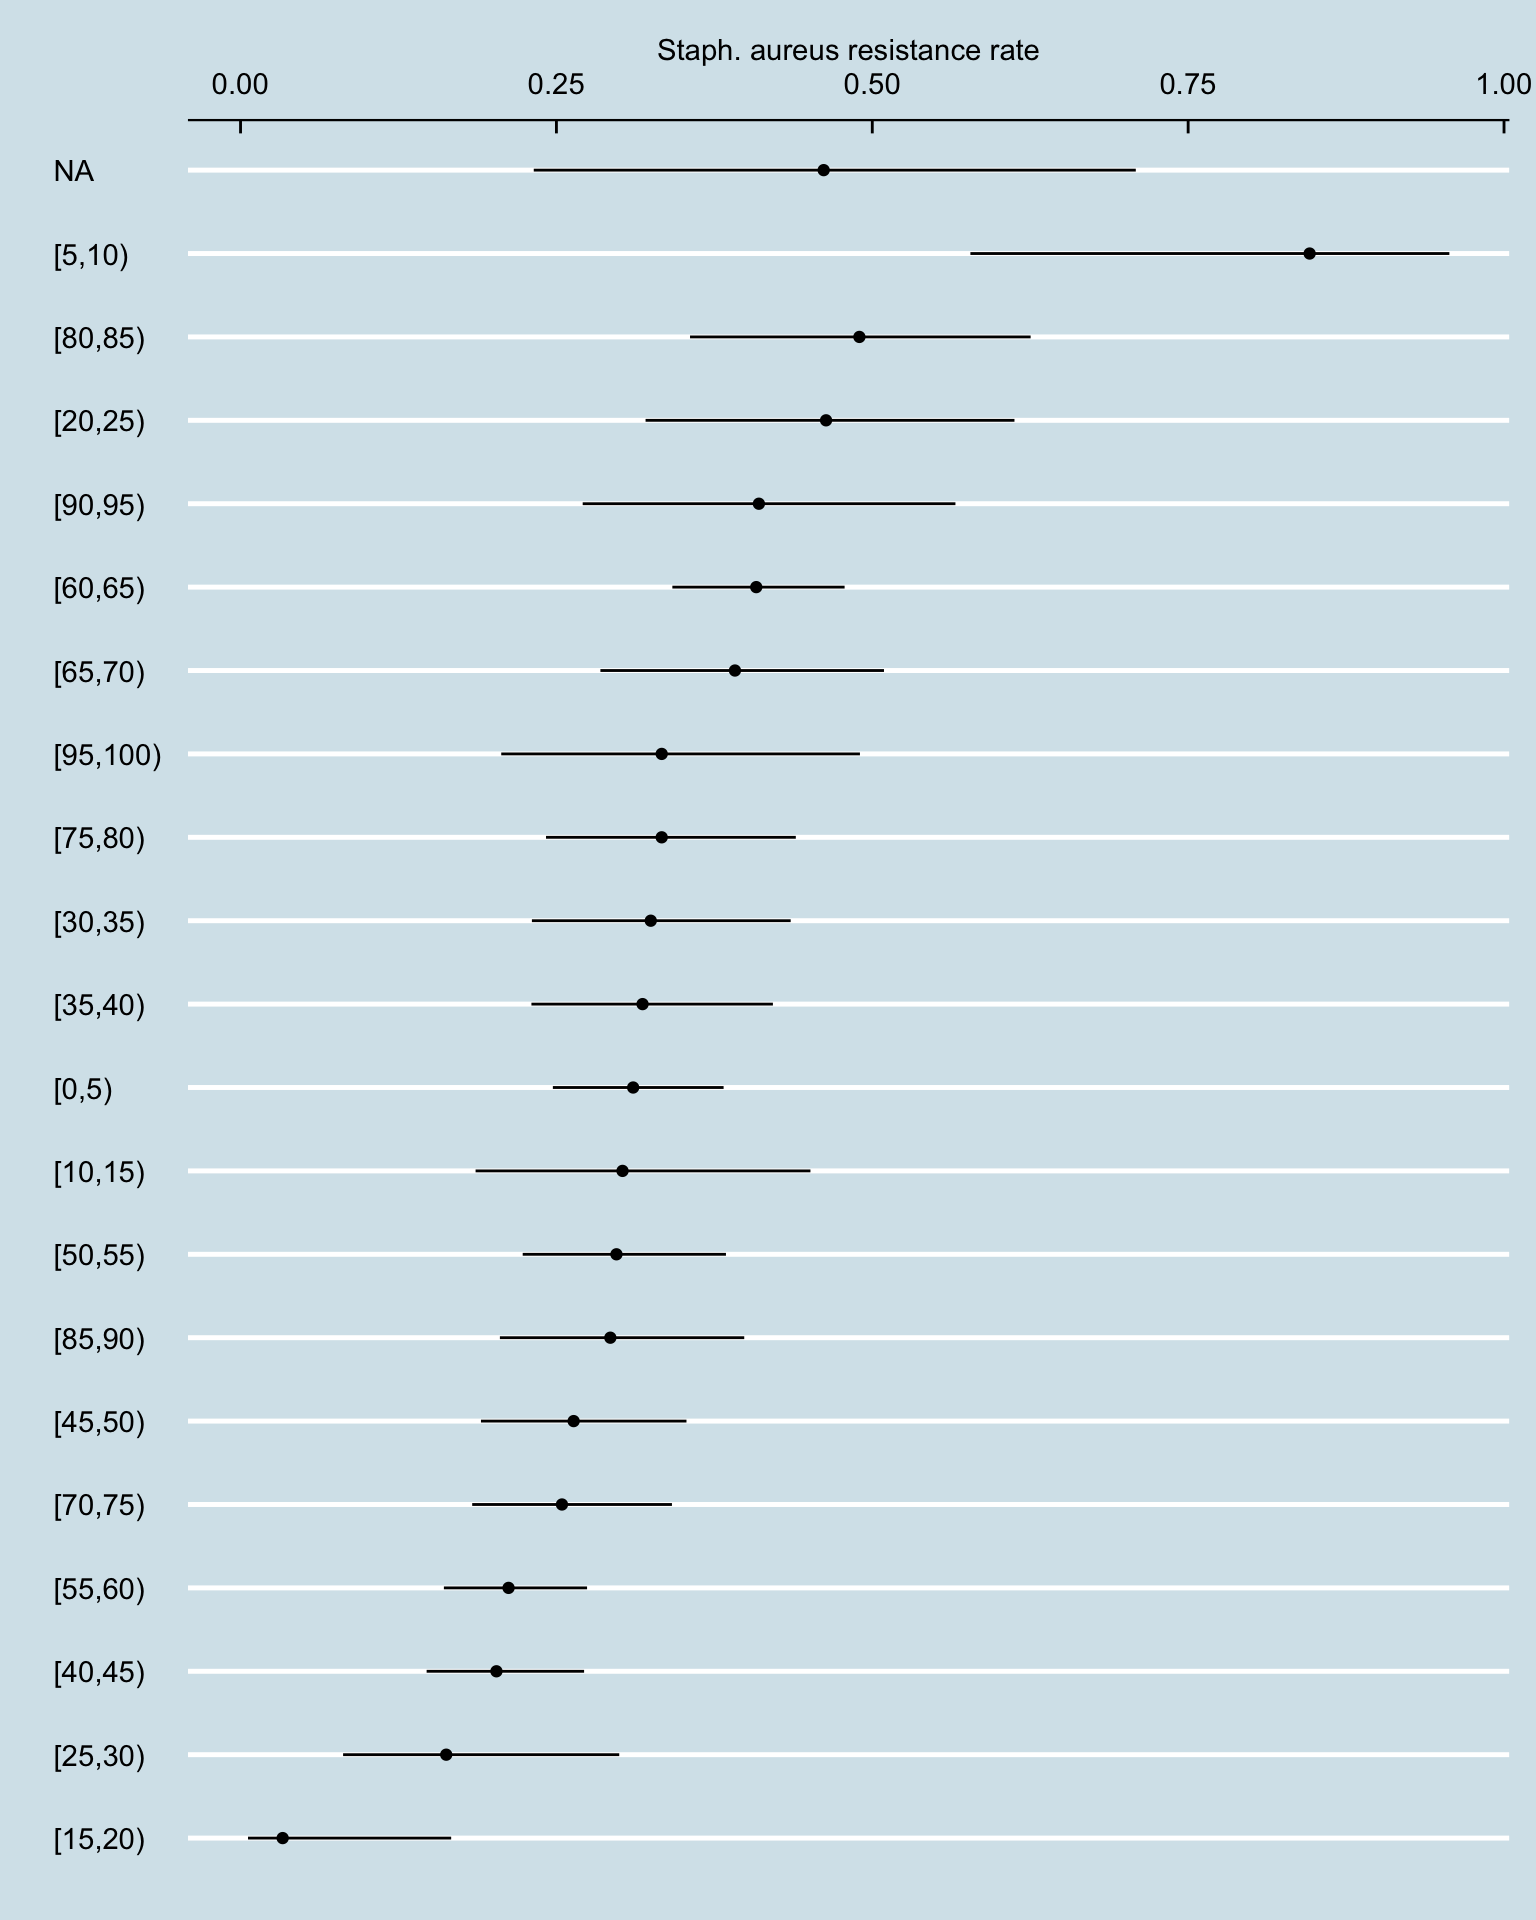
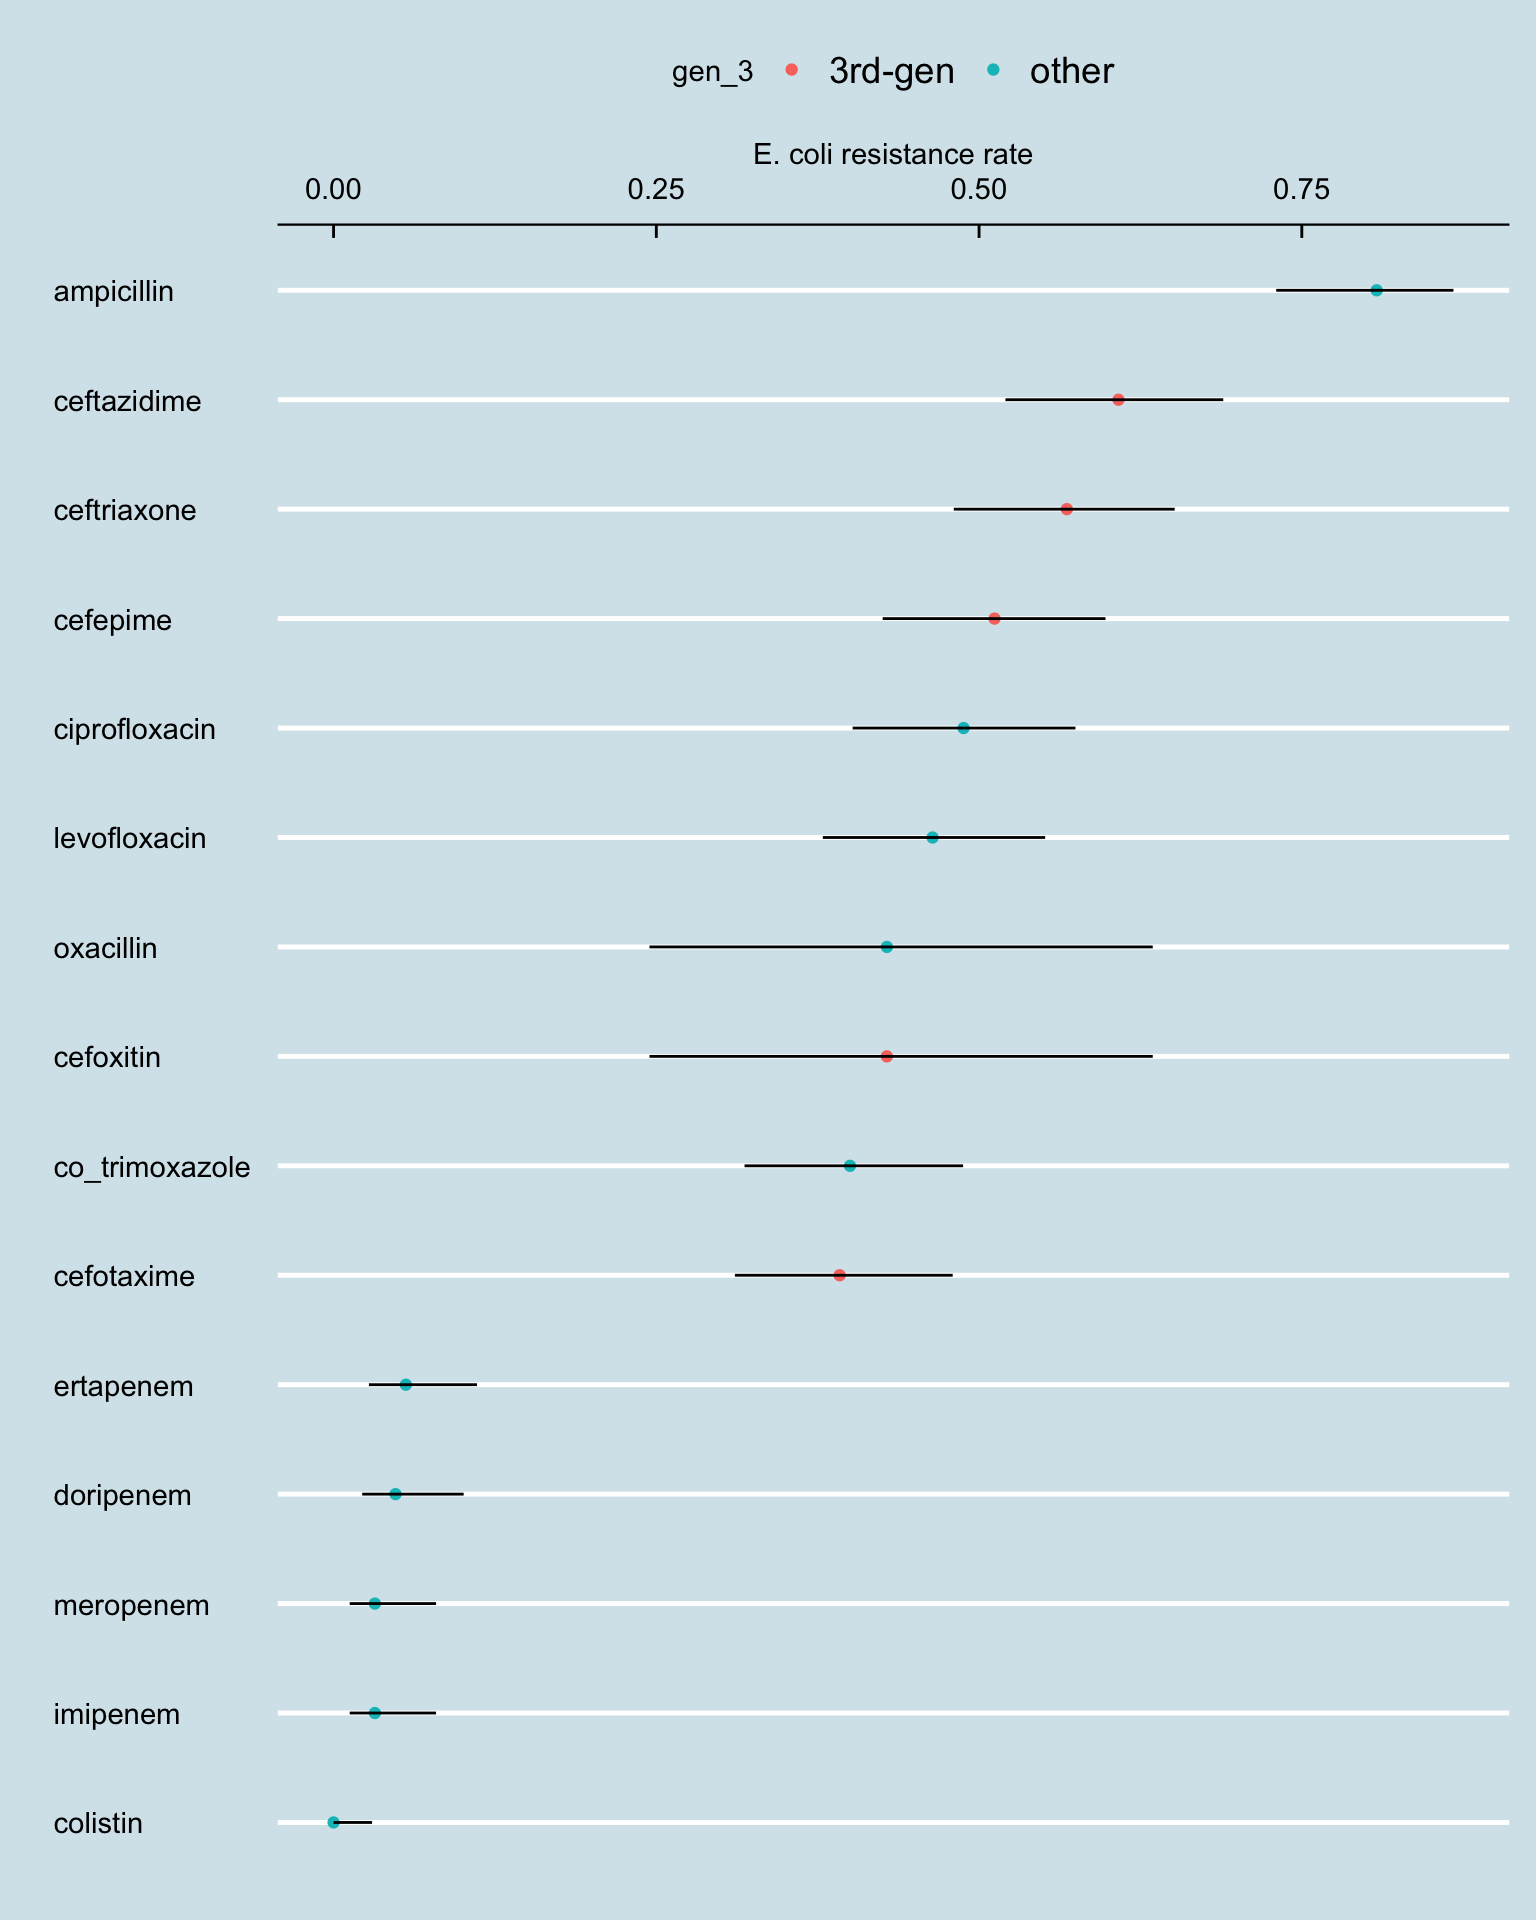
amr_res_ci_ec <- amr_long[str_detect(pathogen_name, "coli") & !is.na(resistance), .N, by = .(antibiotic, resistance, gen_3)] |>
    pivot_wider(names_from = resistance, values_from = N, values_fill = 0) |>
    rowwise() |>
    mutate(total_tests = sum(c_across(R:I), na.rm = TRUE),
           resistance_rate = R / total_tests)

phe_proportion(amr_res_ci_ec, R, total_tests) |>
    bind_cols(amr_res_ci_ec) |>
    ggplot() +
    geom_point(aes(reorder(antibiotic, value), value, colour = gen_3)) +
    geom_linerange(aes(antibiotic, ymin = lowercl, ymax = uppercl)) +
    coord_flip() +
    labs(y = "E. coli resistance rate", x = "") + scale_y_continuous(position = "right")